
Some of our investors first invested in TMB Pre-IPO Shares at around Rs. 220/share on Feb’2018, and since then, here is how the price graph has moved:
Jan 2019 – Rs. 320/share
Nov 2021 – Rs. 725/share
Feb 2022 – Rs. 599/share
Aug 2022 – Rs. 525/share
This translates to a CAGR of roughly around 24.29%+
Now let’s have a look at company’s business model, Financials, Pros, Cons, FAQs, Etc.
Content Bank
Cons of investing in TMB pre-IPO shares
Pros of investing in TMB pre-IPO shares
TMB’s asset quality results have reached a steady and benign stage
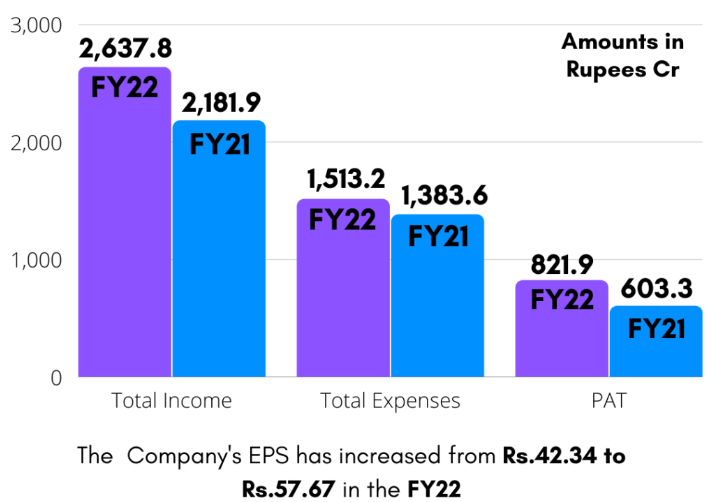
Financial Performance of TMB in FY2022
TMB’s loan growth performance and prospects are appropriate in our opinion
While cost of deposits is relatively on the higher side, the net interest margin outcome is healthy
Why you should invest in TMB IPO
About the Company – TMB
Tamilnad Mercantile Bank (TMB) is one of the oldest and leading old private sector banks in India, with a history of close to a 100 years.
- It primarily focuses on RAM segment (i.e. retail, agriculture and MSME), which constitutes ~88% of total advances as of March 2022
- TMB has built a strong presence in Tamil Nadu, with 369 branches and 949 ATMs as of March 2022. Total branches are 509 of which 247 are in semiurban, 106 in rural, 76 in metro and 80 in urban areas.
Key triggers/Highlights – TMB
- The bank has ~100 year’s legacy with ~80% of its customers associated with the bank for more than five years. The focus on low cost CASA deposits is expected to keep borrowing cost lower
- Focus on new geographies coupled with southern states to accelerate growth
- TMB focuses on increasing its digital footprint, which, in turn, has improved its operational processes, which has reduced costs resulting in improving profitability
- The bank has 369 branches, 949 ATMs in Tamil Nadu with a share of ~75% in total business
- Website: www.tmbnet.in
Cons of investing in TMB pre-IPO shares
- Total ~37.7% of paid up equity share capital is subject to legal proceedings, which are pending in various forums
- Significant regional concentration in southern India i.e. Tamil Nadu
- Current MD & CEO’s tenure to end before the issue opens though RBI has accepted the appointment of the new MD & CEO
Pros of investing in TMB pre-IPO shares
- With nearly 100 years of experience, we have a long track record.
- Strong presence in Tamil Nadu, with a continual focus on expanding into strategic locations.
- Retail, MSMEs, and agriculture have a diverse and devoted consumer base
- With a focus on low-cost retail CASA, the client deposit base has been steadily rising.
- Proven track record of financial performance.
TMB’s asset quality results have reached a steady and benign stage
Based on our exhaustive comparative analysis of 11 mid and smallcap private sector banks, we note that TMB has the lowest GNPA ratio of 1.7% as of FY22, compared with 1.8-8.7% for the remaining peers. The annualised slippage ratio for TMB of 1.6% in FY22 was the 3rd lowest in our comparison universe, with 8 banks ranging between 3.1-6.9%. The annualised credit cost for TMB of 0.4% in FY22 was the 4th lowest, with 7 other banks ranging between 0.4-5.2%. Even so, the PCR including technical write-offs for TMB as of FY22 at 87.9% is the second healthiest in our comparison universe, behind only CSB. TMB’s exposure to corporate loans is low at 12.5% and while the corporate NPL cycle is currently benign, this low exposure also implies a granular loan book leading to greater asset quality stability, ceteris paribus. Furthermore, exposure to higher-risk unsecured retail segments such as credit cards and microfinance is very small with unsecured loans, as a whole, being just 0.83% of total loan book.
Financial Performance of TMB in FY2022
- Operating profit increased from 1,202.04 crores to 1,526.75 crores.
- Net profit Increased from 603.33 crores to 2821.91crores (+36.23%)
- Deposits of the Bank increased from 240,970.42 crores to 44,933.11 crores (+9.67%) during the year
- Gross Advances increased from 31,541.03 crores to 33,748.17 crores (+7.00% ) during the year
- Net Advances increased from 31,069.60 crores to 233,491.54 crores (+7.80%) during the year
- Gross NPAs decreased from 3.44% to 1.69%. Net NPAs decreased from 1.98% to 0.95%
- Provision Coverage Ratio (PCR) increased from 79.53% to 87.92%
The total income increased by 403.20 crores during the year from 24,253.22 crores in the previous year to 24,656.42 crores during the year under review (+9.48%).
TMB’s loan growth performance and prospects are appropriate in our opinion.
TMB’s 3-year FY19-22 loan CAGR of 8.1% ranks fourth among our 11-bank comparison universe. This performance should also be examined in the perspective of the epidemic, when general lending was curtailed. TMB has a defined strategy of focusing on the RAM (Retail, Agri, MSME) bucket, which has achieved a CAGR of 13% over the last two years. TMB has a modest loan book base of Rs 335bn, the third smallest in our comparison universe, and hence growth possibilities should be easier to identify, all else being equal. Furthermore, capital is not an impediment to growth because the common equity tier 1 ratio is the second healthiest in our comparative universe, at 20.4% as of FY22.
We acknowledge that TMB’s growth pattern has traditionally been contiguous, with 76% of advancements centred within Tamil Nadu; hence, the purpose and execution of growth outside Tamil Nadu would be a crucial monitorable in terms of measuring the balance sheet’s long-term scalability.
While cost of deposits is relatively on the higher side, the net interest margin outcome is healthy
Cost of deposits for TMB at 4.9% for FY22 is the second highest in our comparison universe, although not necessarily high in the absolute sense. DCB’s cost of deposits of 6.1% for FY22 would be regarded so. Thanks to a reasonable yield on advances of 9.5% for FY22 for TMB, which is the 5th highest in our comparison universe, the bank achieved a NIM of 4.1% for FY22, which is the 4th best in our comparison universe.
IPO Details – TMB
| Tamilnad Mercantile Bank IPO Date | Sep 5, 2022 to Sep 7, 2022 |
| Tamilnad Mercantile Bank IPO Face Value | ₹10 per share |
| Tamilnad Mercantile Bank IPO Price | ₹500 to ₹525 per share |
| Tamilnad Mercantile Bank IPO Lot Size | 28 Shares |
| Issue Size | 15,840,000 shares of ₹10 (aggregating up to ₹831.60 Cr) |
| Fresh Issue | 15,840,000 shares of ₹10 (aggregating up to ₹[.] Cr) |
| Issue Type | Book Built Issue IPO |
| Listing At | BSE, NSE |
| QIB Shares Offered | Not less than 75% of the Net Offer |
| NII (HNI) Shares Offered | Not more than 15% of the Net Offer |
| Retail Shares Offered | Not more than 10% of the Net Offer |
| Company Promoters | TMB is a professionally managed bank and does not have an identifiable promoters. |
Why you should invest in TMB IPO
TMB would trade at 1.4x FY22 P/B at the upper end of the pricing range. TMB generated a RoA of 1.7% and a RoE of 16.6% in FY22. Importantly, given TMB’s business model, we do not expect these return ratios to be volatile in the future. As a result, we consider TMB’s IPO pricing to be quite appealing.
FAQs – TMB Pre-IPO Shares
How can I buy TMB Pre-IPO Shares?
To invest in TMB Pre-IPO Shares – Click Here
What is TMB Pre-IPO Shares price?
The current market price of TMB Pre-IPO Shares is 545/share (as of Sept’2022)
Is it possible to buy TMB Pre-IPO Shares before listing?
Yes, you can buy TMB Pre-IPO Shares from Altius Investech, they deal in 130+ pre-IPO shares including Tamilnadu Mercantile Bank.