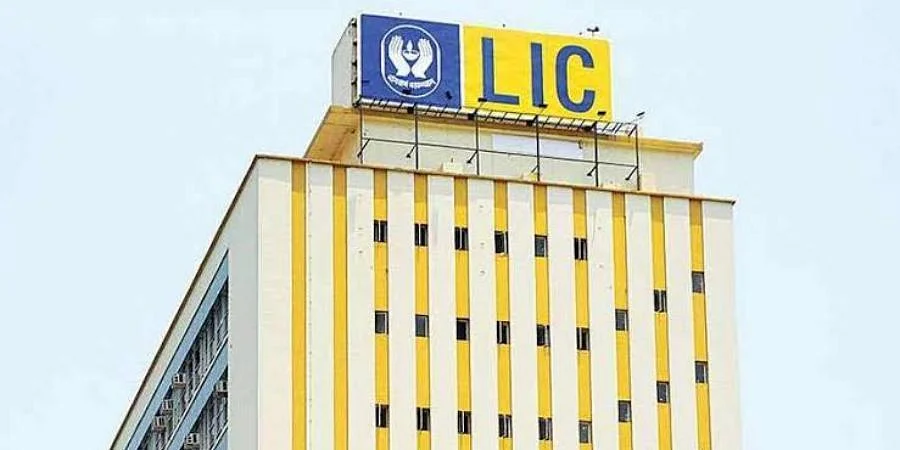
With LIC, the Indian government aims to sell 5% of its stake, nearly INR 65,000 crore, valuing the public insurer at ~18 lakh crore. This is more than 50% of funds raised by all IPOs put together in the last financial year
Table of Contents
ToggleIPO PLANS
The government has set the ball rolling for India’s biggest IPO, with the insurer Life Insurance Corporation (LIC) filing its draft papers with regulator Sebi (Securities and Exchange Board of India) on 8 February 2022.
According to the DRHP (Draft Red Herring Prospectus), public issue type: offer for sale where the government will sell 5% stake or 31.6 crore shares in the insurance behemoth. No fresh stock will be issued for the IPO. The Government holds a 100% stake or over 632.49 crore shares in LIC. The face value of shares is ₹10 apiece.
The government, however, did not disclose in the DRHP the market valuation of LIC or the discount which will be given to policyholders or LIC employees in the public offering.
VALUATION INSIGHT
According to the draft red herring prospectus, LIC’s embedded value, which is a measure of the consolidated shareholders value in an insurance company, has been pegged at about ₹5.4 lakh crore as of September 30, 2021, by international actuarial firm Milliman Advisors.
LIC is the largest asset manager in India with managed assets worth INR 36.8 trillion as of March 31, 2021. LIC’s AUM as of March 31, 2021 is more than 3 times higher than total AUM of all private life insurers in India, is approximately 16.6 times more than the AUM of the second-largest player in the Indian life insurance industry in terms of AUM (SBI Life had the second largest AUM of approximately INR 2.2 trillion) and is also 1.2 times the AUM of the entire mutual fund industry in India, which had AUM of approximately INR 31.4 trillion as of March 31, 2021. Further, the AUM of LIC as of March 2021 was approximately 19% of India’s GDP for Fiscal 2021. As of March 31, 2021, LIC was the largest domestic institutional investor in the Indian financial sector. LIC’s investments in listed equity had carrying/market value of approximately INR 8 trillion, which represented around 4% of the total market capitalisation of NSE as at the same date.
As at September 30, 2021, on a standalone basis, LIC policyholders’ investment portfolio included 37.50% central government securities, 24.78% equity securities, 24.61% state government securities and 8.07% corporate bonds. As at September 30, 2021, 95.89% of the Corporation’s debt AUM on a standalone basis was invested in sovereign and AAA-rated securities. Over 90% of the Corporation’s policyholders’ equity investments on a standalone basis are held in stocks that are a part of the Nifty 200 and BSE 200 indices as at September 30, 2021.
Inspite of huge investment in equity, LIC has given mostly return of close to rolling savings account returns prevailing during the period in endowment plans, which was 200 basis points lesser than other life insurance peers. Differences in the return seems minuscule in a short period but have a huge impact over a long investment horizon.
Given the huge AUM of 36,761 Billion, LIC could only generate a PAT of 0.08% of AUM while other peers in the same market has a far better figures than LIC as shown in the table below:
| PARTICULARS | AUM (INR Billion) | PAT (INR Billion) | PAT (% OF AUM) |
|
LIC |
36761.8 | 29 | 0.08% |
|
SBI LIFE |
2208.7 | 14.6 | 0.66% |
|
HDFC LIFE |
1738.4 | 13.6 | 0.78% |
|
ICICI PRUD LIFE |
2142.2 | 9.6 | 0.45% |
|
MAX LIFE |
904.1 | 5.2 | 0.58% |
|
BAJAJ ALL. LIFE |
737.7 | 5.8 | 0.79% |
The income tax rate applicable for life insurance business is 12.5% (plus surcharge and cess) under the provisions of section 115B of the IT Act. In case the tax rate is increased in the future, it may lead to an adverse impact on the profitability of the Corporation, its ability to reinvest its post-tax profits and distribution of dividends to the Shareholders.
LIC distributes 95% of its profit to policyholders where’s private life insurance cos distribute 90%.
Inspite of huge investment in equity (give details comprehensive) lic has given mostly return of close to rolling savings account returns prevailing during the period in endowment plans
RATIO ANALYSIS
1. LIC has probably the lowest EPS in the industry despite being the largest player & more room for minting profits.
Trend in EPS for Peer Set (refer fig below):

At an expected price band of INR 2100 and EPS of 4.6, LIC would trade at 490+ P/E. While HDFC Life trades at ~90 P/E, SBI life trades at ~70 P/E, LIC looks extremely overvalued and its a matter of doubt whether it will sail through or not.
2. LIC has the poorest Solvency ratio among its peers:

3. Persistency ratios decreased as at March 31, 2020. Persistency ratio is the proportion of business that is retained from the business underwritten and is measured in terms of the number of policies and premiums underwritten (the “Persistency Ratio”). For example, Persistency Ratio by individual business in India in the 13th month was 72% as at March 31, 2020 compared to 77% as at March 31, 2019
Key Takeaway
While LIC has some stellar number when considering the overall size in terms of market share and AUM but what needs to be understood is that LIC had decades where it was the only life insurance provider to the worlds second most populous country.
But if you deep dive into the numbers a little more, it does not seem to be a very attractive proposition as far as an investment is concerned. So
Do Check out our trading portal for investing in unlisted shares here. Always looking to chat about markets, reach out to us on 9038517269 ; abhishek@altiusinvestech.com


Very very useful information for retail investors.